CityFormGen: Benchmarking Generative and Optimisation Methods for Multi-Objective Middle-Housing Design
RESEARCH GENERATIVE-DESIGN BENCHMARK - NOT CONSTRUCTION DOCUMENTATION OR CODE CERTIFICATION.
Abstract
We compare generative and optimisation methods for small multi-unit ("middle") housing on 72 seeded briefs covering six typologies and three difficulty bands. Every method is scored by one checker of 17 benchmark constraints and a vector of six proxy objectives, under a matched budget of 1,500 evaluations per run (CP-SAT: 6.4 s, the median time NSGA-II needs for that budget), across 1,368 runs. At the matched budget, heuristic-seeded NSGA-II has the highest solve rate (57%), the deterministic heuristic the highest mean hypervolume (0.084), while 100% of the designs CP-SAT returned are feasible but it solves only 45% of runs; the pre-registered hypothesis that constraint programming is the most feasible method is therefore not supported at matched compute, although with four times the time CP-SAT solves 61% of briefs (exploratory). NSGA-II beats simulated annealing on hypervolume and spread, no method is best on every objective, and solve rates depend strongly on typology. Search quality had not saturated at the matched budget. Within the proxies, denser designs carry less modelled embodied carbon per square metre (Spearman ρ = 0.88) and less daylight (ρ = -0.36). An LLM-proposal condition (Claude Opus 5 with deterministic repair) is implemented but was not run for this release. All metrics are proxies. RESEARCH GENERATIVE-DESIGN BENCHMARK - NOT CONSTRUCTION DOCUMENTATION OR CODE CERTIFICATION.
1 Introduction
Generative design for housing is usually demonstrated one method at a time, on one brief, with a success criterion the method was tuned for. Language models now produce plausible-looking floor plans in seconds, which makes the absence of a common yardstick more pressing: a plan that looks right can violate its own programme, bury a bedroom with no window, or leave an upper-floor flat with no way to the street.
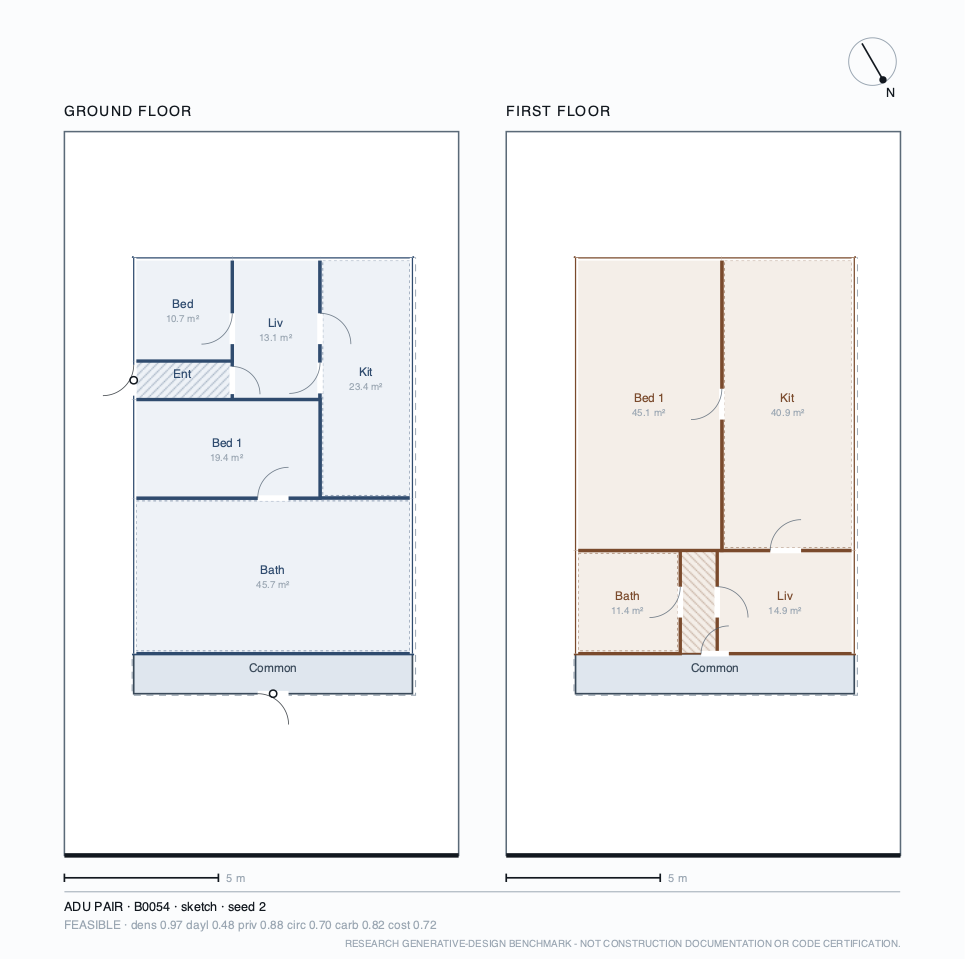
Middle housing — duplexes to small courtyard blocks — is a useful test bed because it is small enough to benchmark at scale and constrained enough to be hard: several dwellings share one lot, one core and one set of setbacks; upper flats need street access through that core; party walls and overlooking matter for privacy; and every square metre of footprint trades against open space.
CityFormGen asks: under matched briefs and compute, which methods best explore the trade-off between hard feasibility and several competing performance objectives? Its contributions are:
- a formal, versioned representation and a seeded, difficulty-balanced brief generator for multi-unit, multi-storey housing, with 17 benchmark constraints and six proxy objectives;
- a matched-compute comparison of a deterministic heuristic, random search, simulated annealing, NSGA-II, CP-SAT on a different (non-guillotine) representation, and seeded pipelines, all scored by one checker;
- a deterministic repair pipeline and a repair-distance measure, making "how much cleanup does a proposal need" a number;
- pre-registered hypotheses with dated amendments, a calibrated carbon proxy, and sensitivity analyses for weights, reference points and coefficients;
- an interactive site and a reproduction path in which every reported number is generated from the result tables.
3 Design representation
Designs live in a metric site frame: origin at the front-left lot corner on the street, x along the street, y into the lot. Rooms are axis-aligned rectangles on storeys, owned by a dwelling or shared. Doors and windows are derived deterministically from geometry — a door-routing spanning structure that never joins a forbidden pair, and windows on every exterior segment long enough to take one — so they are never free parameters.
The tree-based methods search a genome of guillotine slicing trees: a macro tree decoded once for every storey (common core, courtyard void, dwelling zones or maisonette columns), per-storey trees placing dwellings, and per-dwelling trees placing rooms. Decoded designs therefore tile their envelope exactly, and cores, stairs and courtyards stack by construction. Two consequences of the guillotine leaf shape are disclosed: a common core is modelled as a front access gallery, and a courtyard needs a fixed parti (a free guillotine tree cannot enclose a void). CP-SAT uses free rectangles on a 0.5 m grid instead, and a proposal from any source may be arbitrary rectangles; the checker and objectives accept any design.
4 Benchmark briefs
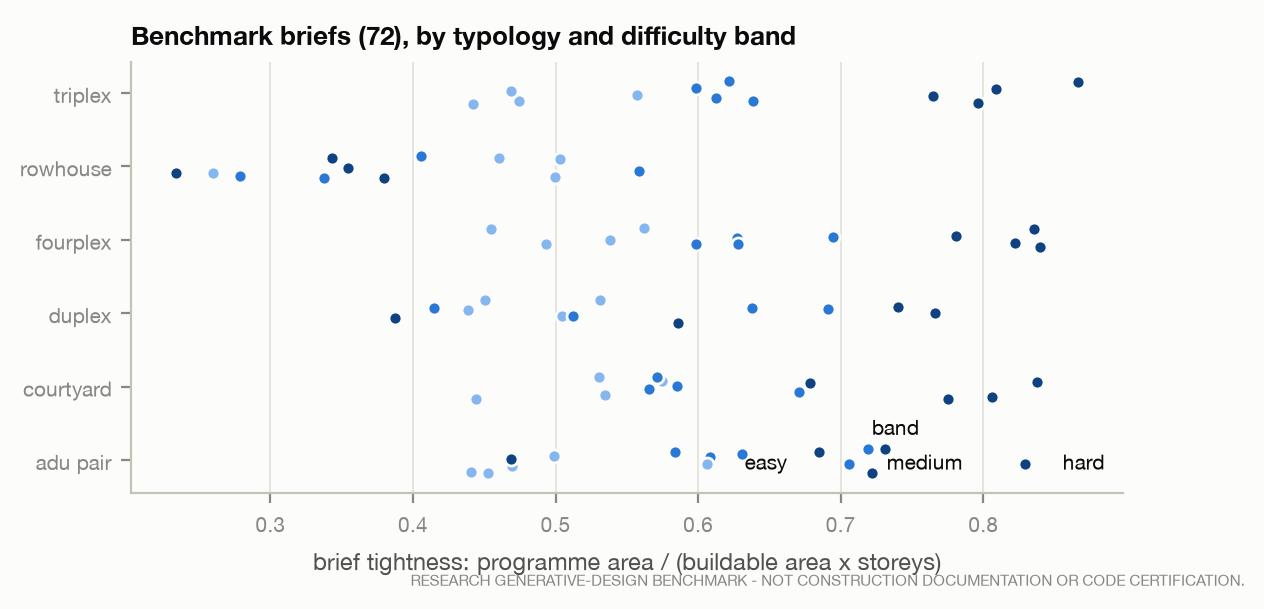
Briefs are generated from a master seed (brief-set version 1.1.0, hash 31a635ad375385d2). Six typologies — duplex, triplex, fourplex, rowhouse (maisonettes), courtyard housing, and a principal dwelling with an accessory unit — each receive a unit mix, setbacks, an open-space target, optional parking and priority weights. Difficulty is controlled rather than observed: the generator samples a target tightness (programme area over buildable volume) in one of three bands and solves for the lot size, with a frontage appropriate to the typology. The first 72 briefs contain twelve per typology and twenty-four per band.
5 Benchmark constraints
A design is feasible when it violates none of the 17 constraints below. They are benchmark rules, not building code; no jurisdiction is implied, and none was reviewed by an architect or code official.
| ID | Constraint | Rule |
|---|---|---|
| C01 | geometry valid | Every room rectangle is finite with strictly positive extents. |
| C02 | no overlap | No two rooms on the same storey overlap. |
| C03 | within buildable | Every room lies inside the lot minus its setbacks. |
| C04 | min room area | Each room meets the benchmark minimum area for its type. |
| C05 | min room dimension | Each room's shorter side meets the benchmark minimum clear dimension. |
| C06 | max room aspect | Each room's aspect ratio is within the benchmark maximum for its type. |
| C07 | min unit area | Each dwelling meets the brief's minimum floor area. |
| C08 | unit connectivity | Every room of a dwelling is reachable from that dwelling's entry. |
| C09 | street access | Every dwelling's entry is reachable from the street. |
| C10 | habitable daylight | Every habitable room has an exterior wall able to take a window. |
| C11 | required adjacency | Brief-required room adjacencies are present as door-capable contacts. |
| C12 | forbidden door | No door connects a brief-forbidden pair of room types. |
| C13 | open space | Open space net of parking meets the brief's target fraction of the lot. |
| C14 | courtyard provision | A required courtyard void is delivered at usable size. |
| C15 | programme complete | Every room the brief requires is present, once, on its required storey. |
| C16 | unit contiguity | A dwelling's rooms on a storey form a single contiguous block. |
| C17 | vertical support | Every upper-storey room sits over built floor area on the storey below (a stacking proxy, not a structural check). |
6 Objectives
Six objectives are kept as a vector and never collapsed into one score: density (floor area delivered relative to the buildable volume), daylight (a geometric availability score per habitable room), privacy (bedroom depth from entry and street, foreign party walls, overlooking), circulation (corridor share, walking distance, reach), embodied carbon (a material-quantity proxy, product stage A1–A3 of the modelled elements only) and a unitless construction-cost index. Scores are normalised to [0, 1], higher is better, and raw values are stored.
The carbon coefficients are illustrative light-frame timber values chosen so that whole-building intensity falls inside the published residential band (the LETI 2030 target of about 300 kgCO₂e/m² GIA against a typical baseline near 500); a test fails if any feasible test design leaves 250–700. Claims are comparative, and each coefficient is perturbed by ±50% in Section 12.
After the density band was moved to its natural ceiling (amendment 4), 4% of feasible designs sit at the top of the density band. The carbon score varies least of the six (standard deviation 0.056), a point returned to in Section 12.
7 Methods compared
- A · heuristic: a deterministic planner. It sizes the envelope for open space, enumerates twelve partis, lays each dwelling out as a service band on its access side with living and night bands beyond (so entry–living and kitchen–living adjacency hold by construction), then refines proportions by coordinate descent. It stops when no step improves, often before the budget is spent.
- B · random search: independent random genomes; the floor any optimiser must clear.
- C · simulated annealing: Metropolis acceptance on a weighted sum of the brief's priorities minus a normalised constraint penalty; geometric cooling; four restarts.
- D · NSGA-II: population 32, constrained domination (feasible beats infeasible, then Pareto rank and crowding), whole-tree uniform crossover.
- E · CP-SAT: free rectangles on a 0.5 m grid; a feasibility solve, then one warm-started solve per priority regime; single-threaded with a deterministic time limit.
- Seeded pipelines: a proposal (a random sketch of the right programme, or the heuristic's first parti) is repaired and used to seed NSGA-II on the same budget. They are the controls for F.
- F · LLM + repair: Claude Opus 5 proposes a schematic plan in a strict JSON schema from the same rules the checker applies; the same repair and seeded NSGA-II follow. Implemented and tested offline; not run in this release.
8 Evaluation protocol
The STANDARD tier runs 72 briefs × 3 seeds for each method (the deterministic heuristic once per brief). Every candidate any method wants scored passes through a single metered evaluator, which refuses further work once the budget is spent. Evaluation-budgeted methods get a wall-clock cap that must never bind; every run records which budget bound it, and none was bound by time.
Hypervolume uses the origin of the normalised space as reference and is estimated by Monte Carlo on one fixed cloud of 262,144 samples, so differences between methods on a brief are paired (common random numbers). Metrics are averaged over seeds within a brief; differences are bootstrapped over briefs (10,000 resamples, percentile 95% intervals), with sign-flip permutation p-values Holm-corrected within each hypothesis. The hypotheses, thresholds and tests were committed before the main run; four amendments were made before it, each dated in the repository (tier size, budget semantics, a correction to how open ground in front of a wall is measured, and the density band).
9 Results
At least one method found a feasible design for 62 of 72 briefs. The remaining 10 are unsolved within the budget — not proven infeasible — and 7 of them are in the hard band.
| Method | Solve rate [95% CI] | Hypervolume [95% CI] | Feasible share of evaluated designs | Spread | Runtime s | Evals |
|---|---|---|---|---|---|---|
| Heuristic (A) | 0.53 [0.42, 0.64] | 0.084 [0.064, 0.104] | 0.187 | 0.023 | 2.0 | 488 |
| NSGA-II (D) | 0.53 [0.43, 0.63] | 0.078 [0.060, 0.097] | 0.114 | 0.076 | 6.1 | 1500 |
| Sketch + repair + NSGA-II | 0.44 [0.36, 0.54] | 0.067 [0.051, 0.084] | 0.074 | 0.047 | 5.7 | 1500 |
| CP-SAT (E) | 0.45 [0.34, 0.56] | 0.063 [0.045, 0.083] | 1.000 | 0.086 | 5.2 | 16 |
| Heuristic-seeded NSGA-II | 0.57 [0.47, 0.68] | 0.061 [0.047, 0.076] | 0.118 | 0.052 | 6.1 | 1500 |
| Simulated annealing (C) | 0.42 [0.32, 0.52] | 0.056 [0.041, 0.072] | 0.060 | 0.059 | 5.1 | 1500 |
| Random search (B) | 0.18 [0.09, 0.26] | 0.017 [0.008, 0.026] | 0.001 | 0.032 | 5.0 | 1500 |
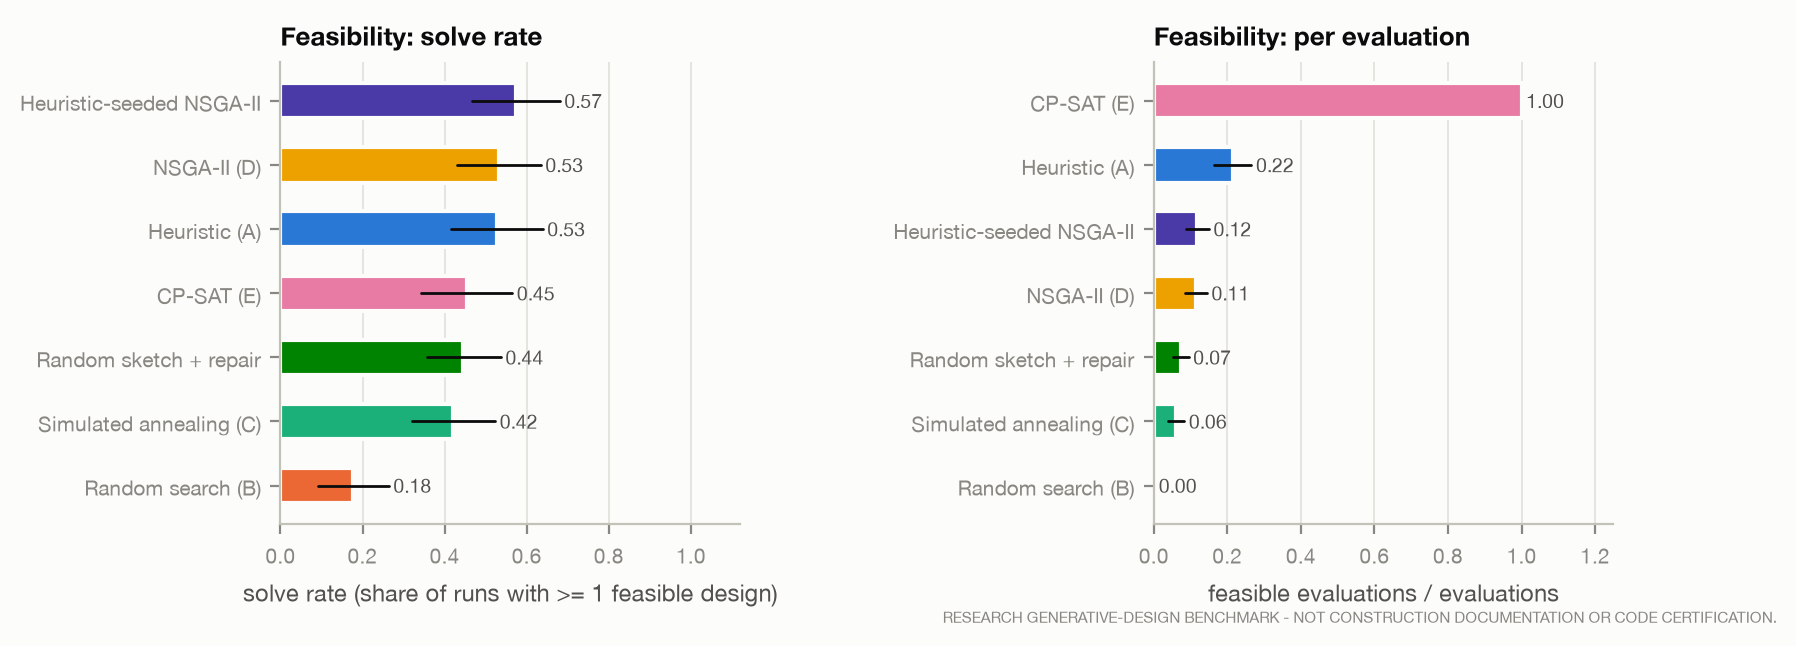
H0 (optimisation beats random search) is supported: NSGA-II adds 0.061 hypervolume [0.047, 0.076] and simulated annealing 0.040 [0.030, 0.050] over random search.
H1 (constraint programming is the most feasible) is not supported. CP-SAT's solve rate is -0.12 below that of heuristic-seeded NSGA-II [-0.24, 0.00]. CP-SAT is the most *reliable* method when it returns anything — its outputs are feasible at the highest rate — but it timed out without a solution on 97 of 216 runs, and its encoding (sufficient, and stricter than the checker in places) was proven unsatisfiable on 21.
H2 (NSGA-II finds broader fronts than simulated annealing) is supported on both parts: hypervolume +0.022 and spread +0.017, both intervals above zero.
H5 (no method dominates) is supported: the method with the best mean value differs across the six objectives and runtime (4 different winners). H3 and H4 were not run.
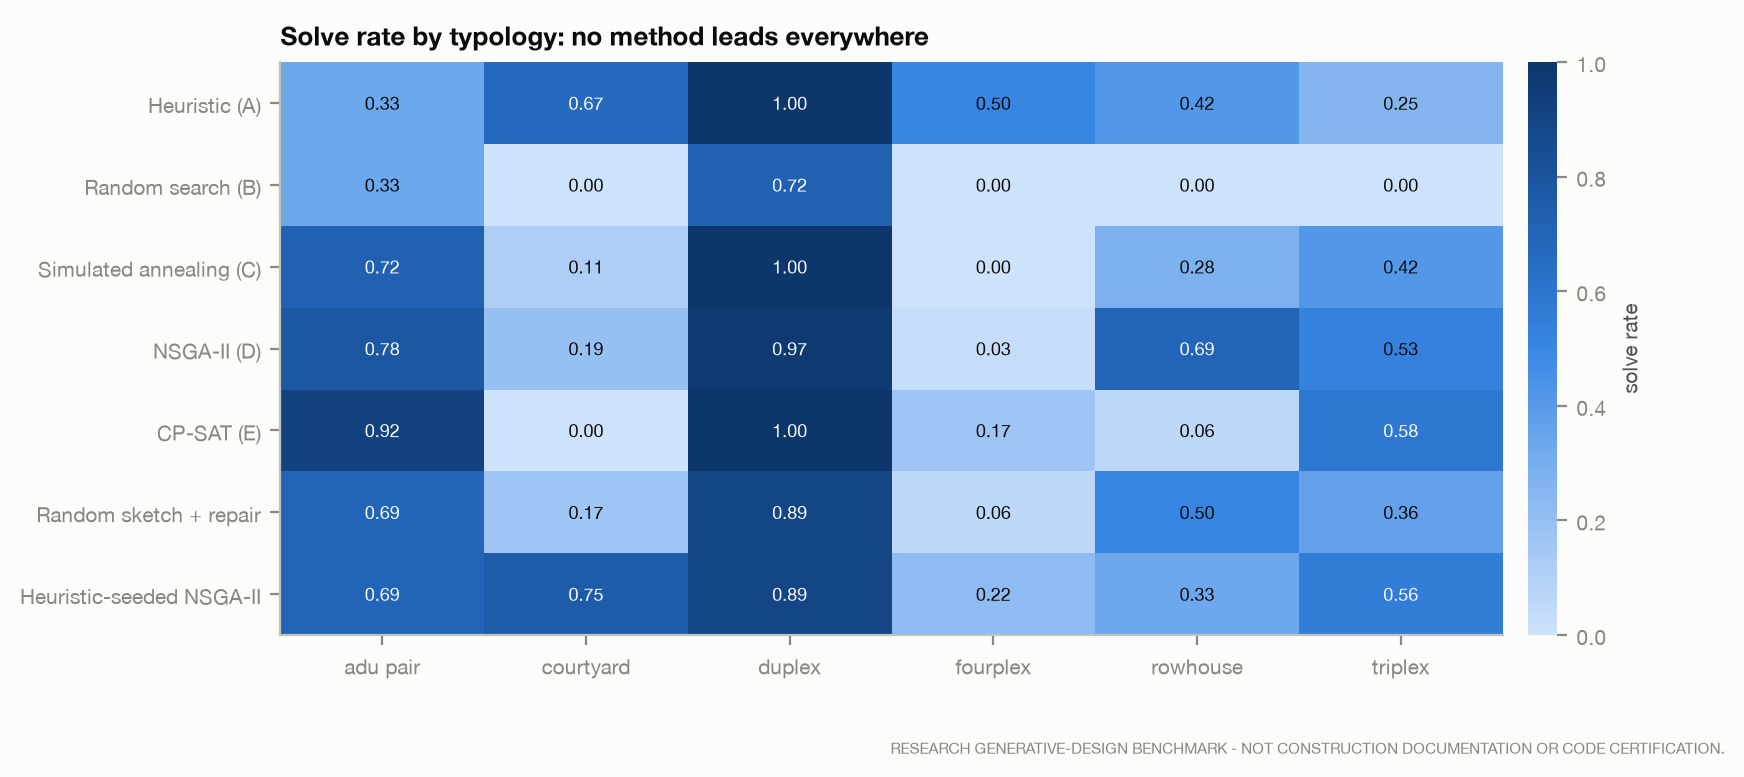
Typology matters more than any single ranking suggests. on adu pair briefs CP-SAT leads (0.92); on courtyard briefs heuristic-seeded NSGA-II leads (0.75); on duplex briefs simulated annealing leads (1.00); on fourplex briefs the deterministic heuristic leads (0.50); on rowhouse briefs NSGA-II leads (0.69); on triplex briefs CP-SAT leads (0.58). CP-SAT solves 100% of duplex runs but 0% of courtyard runs, where the heuristic's fixed parti reaches 67%.
10 Convergence and compute
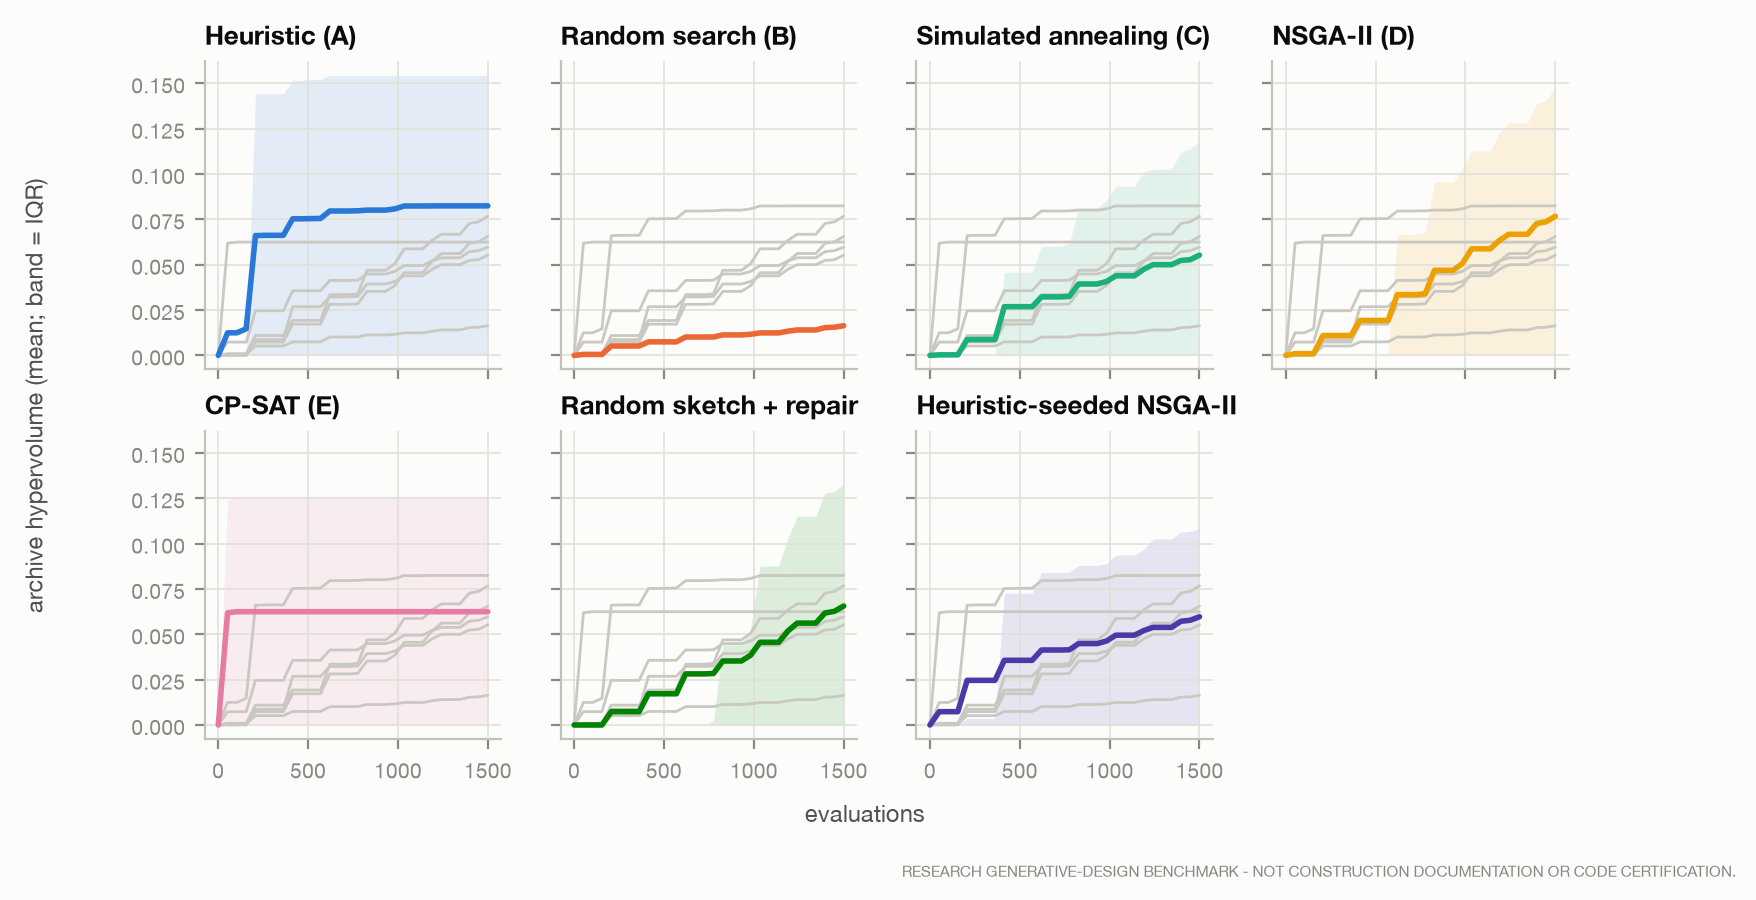
At the matched budget, the heuristic has reached 97% of its final hypervolume by half-way, NSGA-II only 44%.
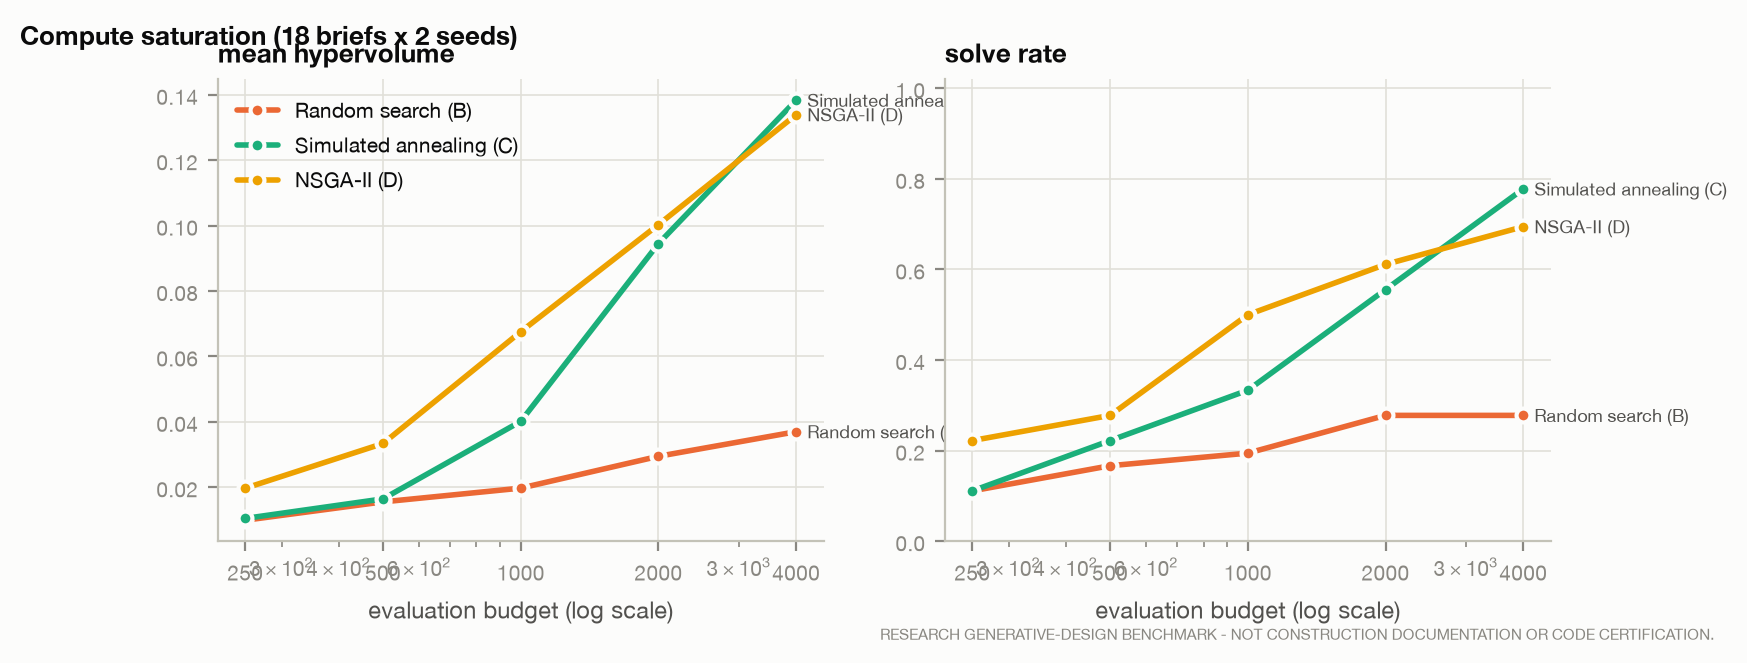
A separate sweep confirms that search quality had not saturated at the matched budget. NSGA-II's mean hypervolume rises from 0.068 at 1,000 evaluations to 0.134 at 4,000, and simulated annealing from 0.040 to 0.138. At 4,000 evaluations simulated annealing matches or exceeds NSGA-II on this subset, so H2 holds at the matched budget but is budget-dependent. This sweep is exploratory.
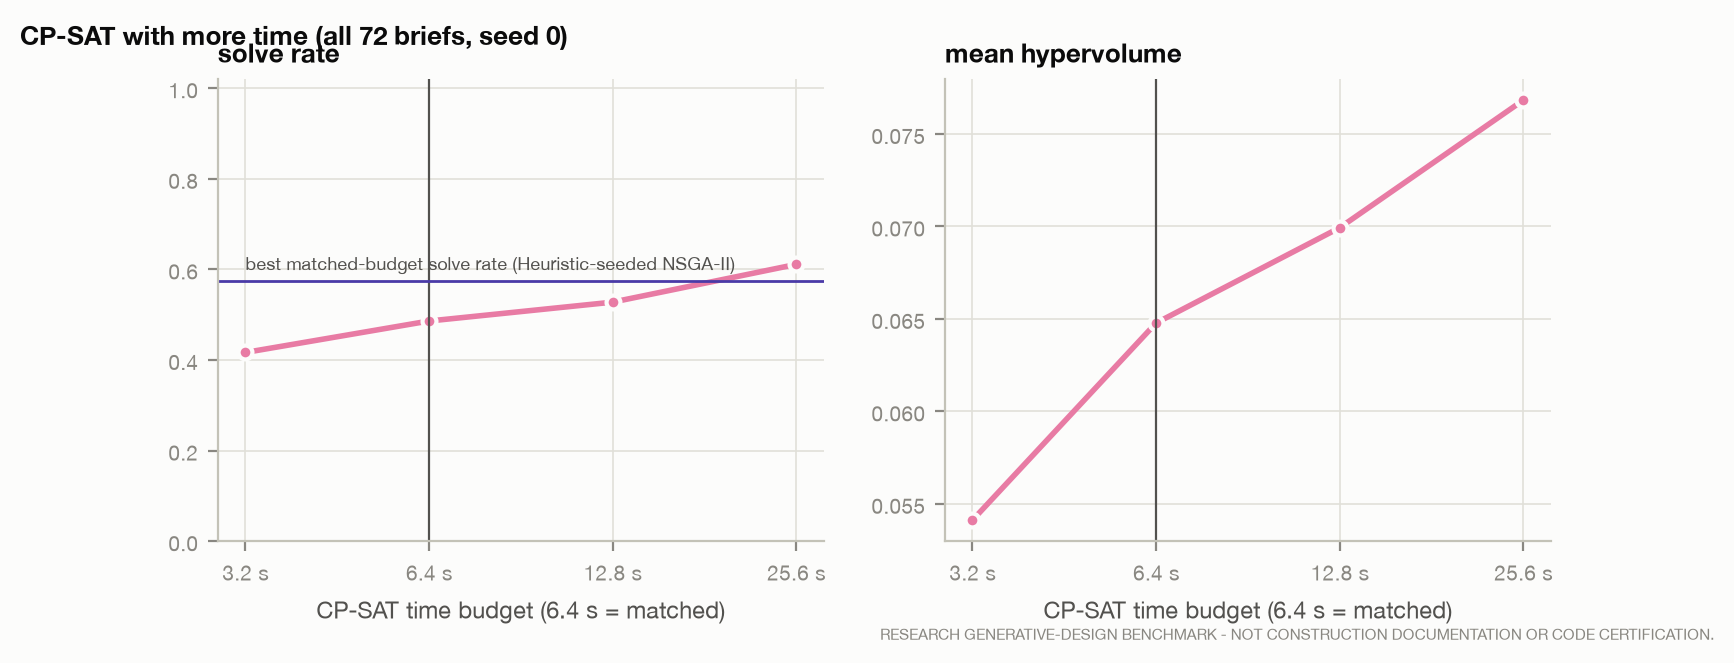
CP-SAT's solve rate rises with time, from 42% at half its matched time (the pre-registered robustness check) to 61% at four times, above the best matched-budget solve rate of any method. H1's failure is a statement about matched compute, not about constraint programming's ceiling.
11 What stops designs
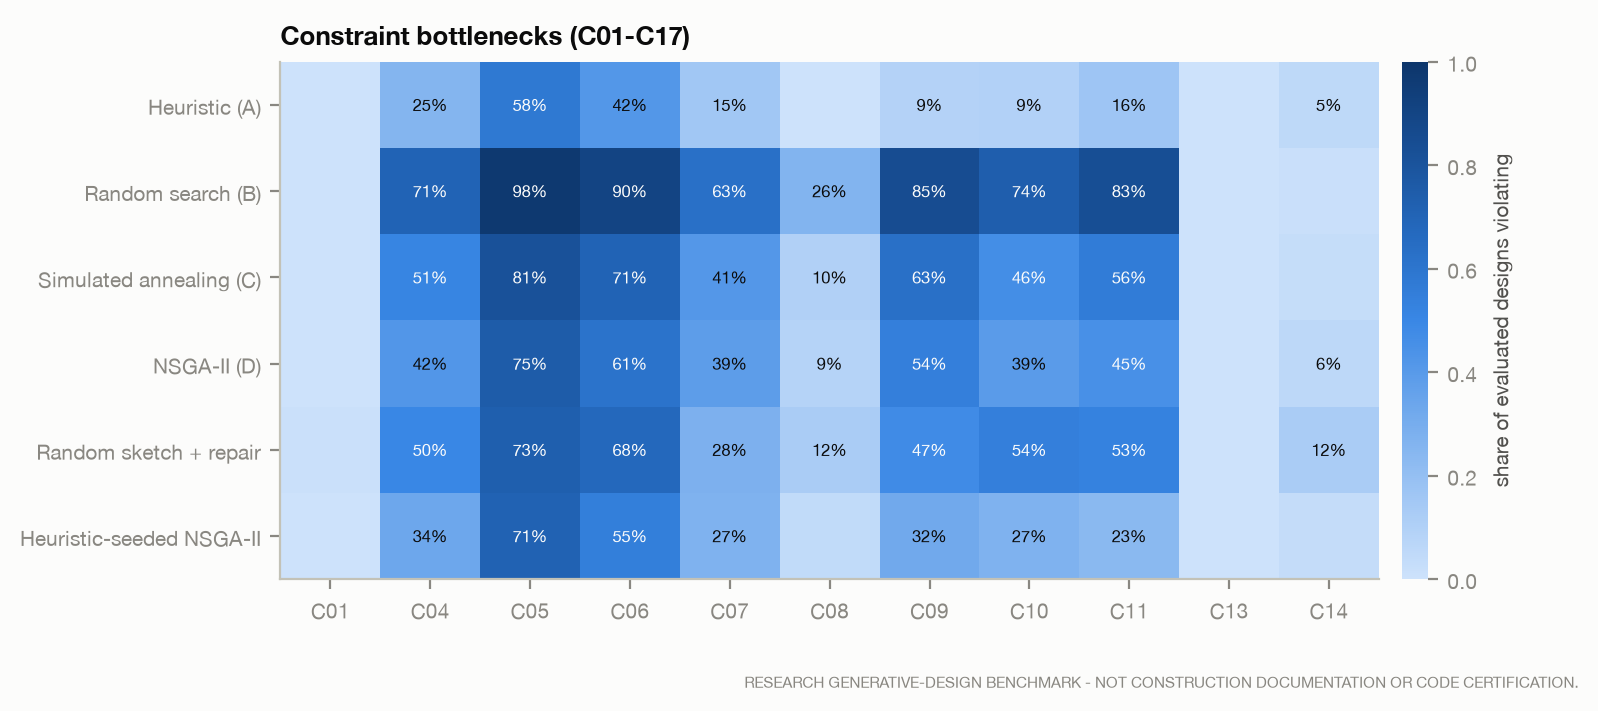
Counted over every evaluated design, the proportion constraints dominate: minimum room dimension (C05) and maximum aspect ratio (C06) are violated most often, followed by street access (C09), required adjacency (C11), minimum room area (C04) and habitable daylight (C10). Counting only designs that failed a single constraint, min room dimension is the most frequent sole obstacle (42,759 designs). The open-space constraint (C13) almost never binds under the generated setbacks, which is a weakness of the brief generator rather than a finding about design.
12 Pareto analysis
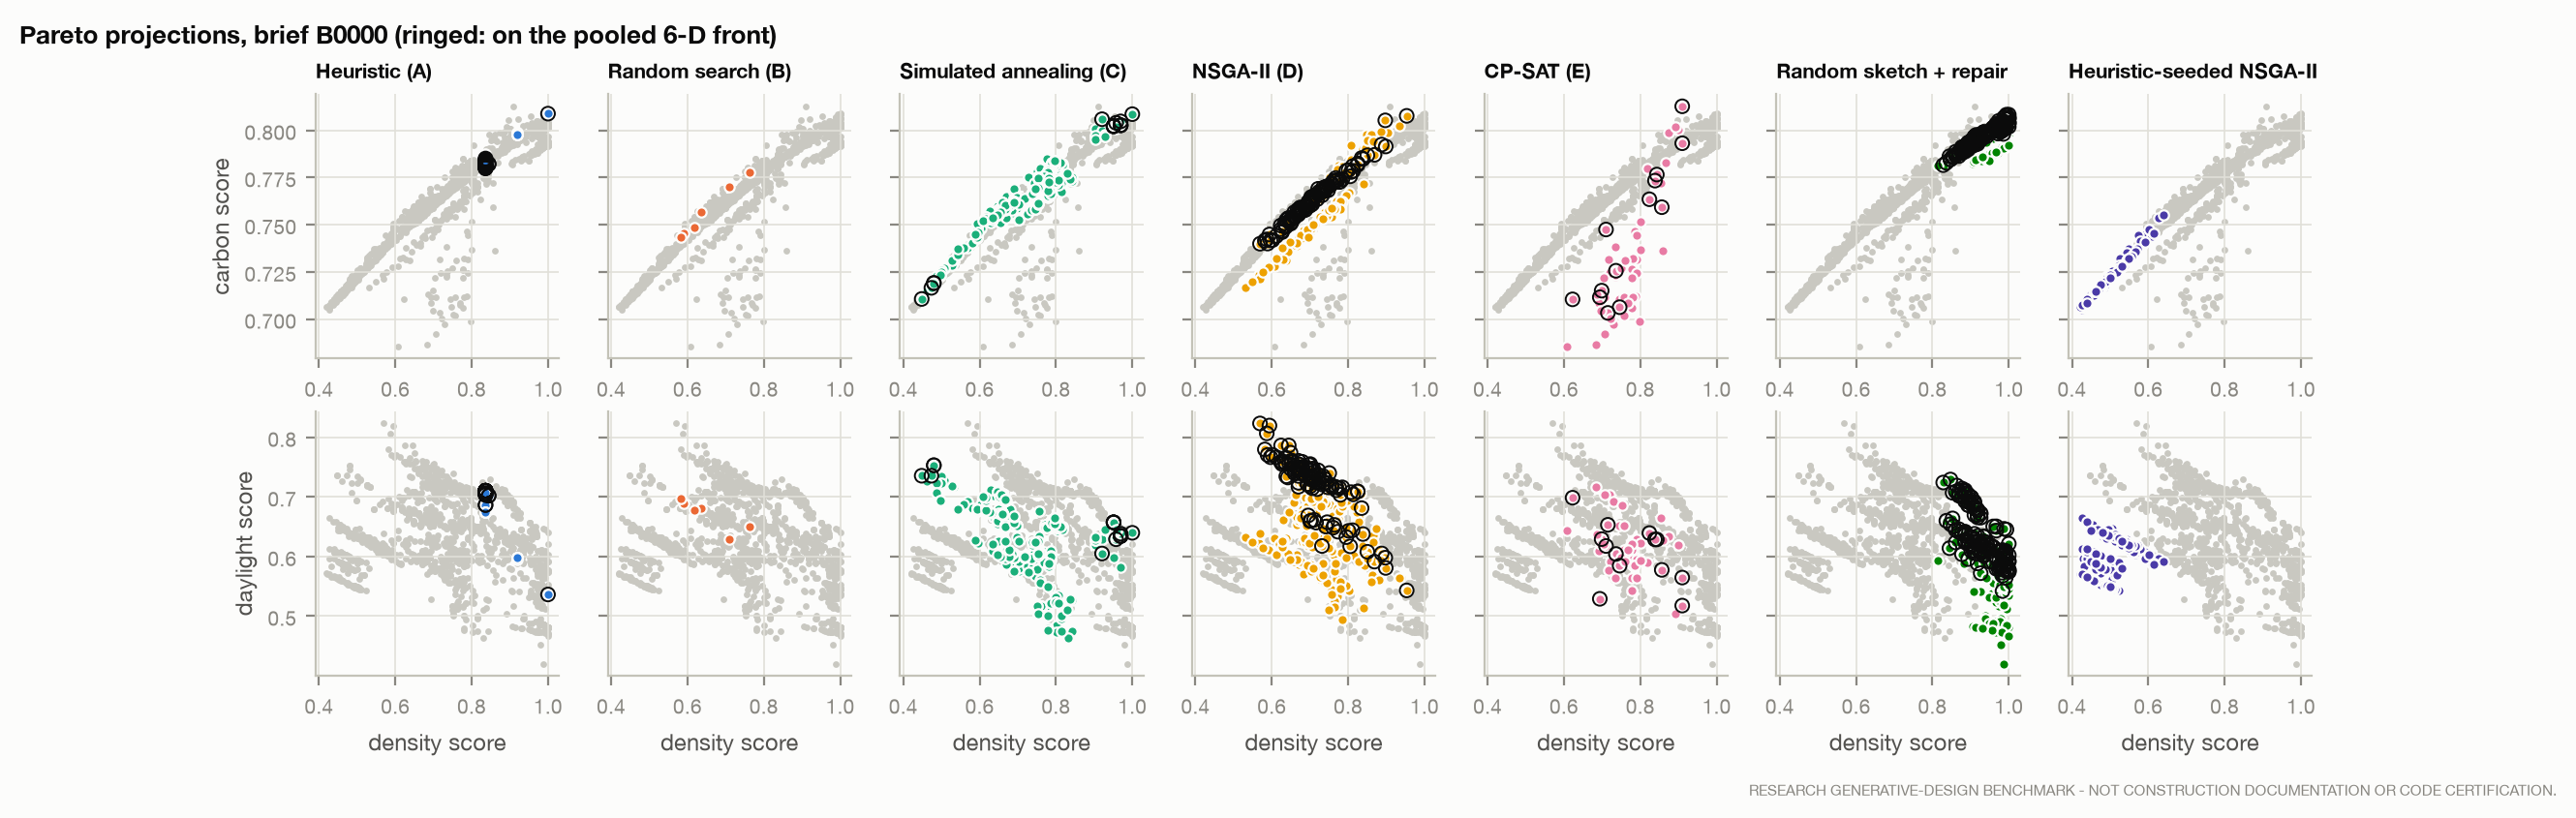
Pooling every method's feasible designs per brief and keeping the six-objective nondominated set, heuristic-seeded NSGA-II contributes 26%; NSGA-II contributes 24%; random-sketch + repair + NSGA-II contributes 22%; the deterministic heuristic contributes 13%; CP-SAT contributes 8%; simulated annealing contributes 7%; random search contributes 0%. The heuristic, which has the highest mean hypervolume, contributes a modest share: its fronts are high but narrow (the lowest spread of any method).
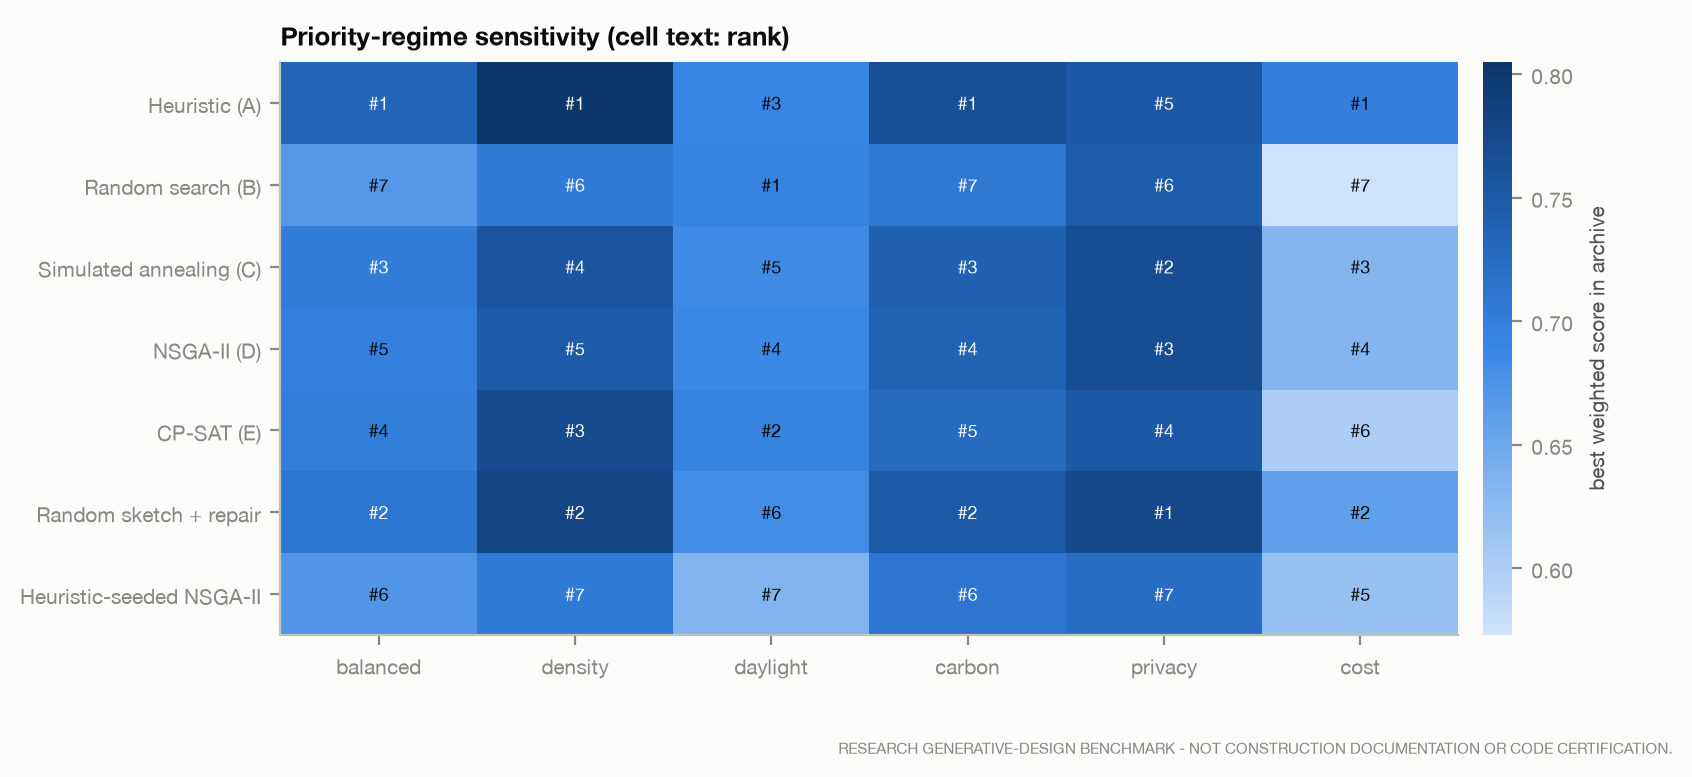
Rankings change with priorities: the method whose archive offers the best weighted design differs across regimes (balanced → the deterministic heuristic; density → the deterministic heuristic; daylight → random search; carbon → the deterministic heuristic; privacy → random-sketch + repair + NSGA-II; cost → the deterministic heuristic). Conclusions about which method to use depend on what the brief values. The hypervolume ranking, by contrast, is unchanged when the reference point moves to 0.1 or 0.2 (Kendall τ 1.00 and 1.00).
13 LLM proposals and repair
The LLM condition did not run: no model credentials were configured for this release, so hypotheses H3 and H4 are reported as not run and nothing in this paper is estimated from substitute data. The proposer, prompt, schema and frozen-record format are implemented and tested offline; a record served by a fallback model would be excluded from the primary analysis.
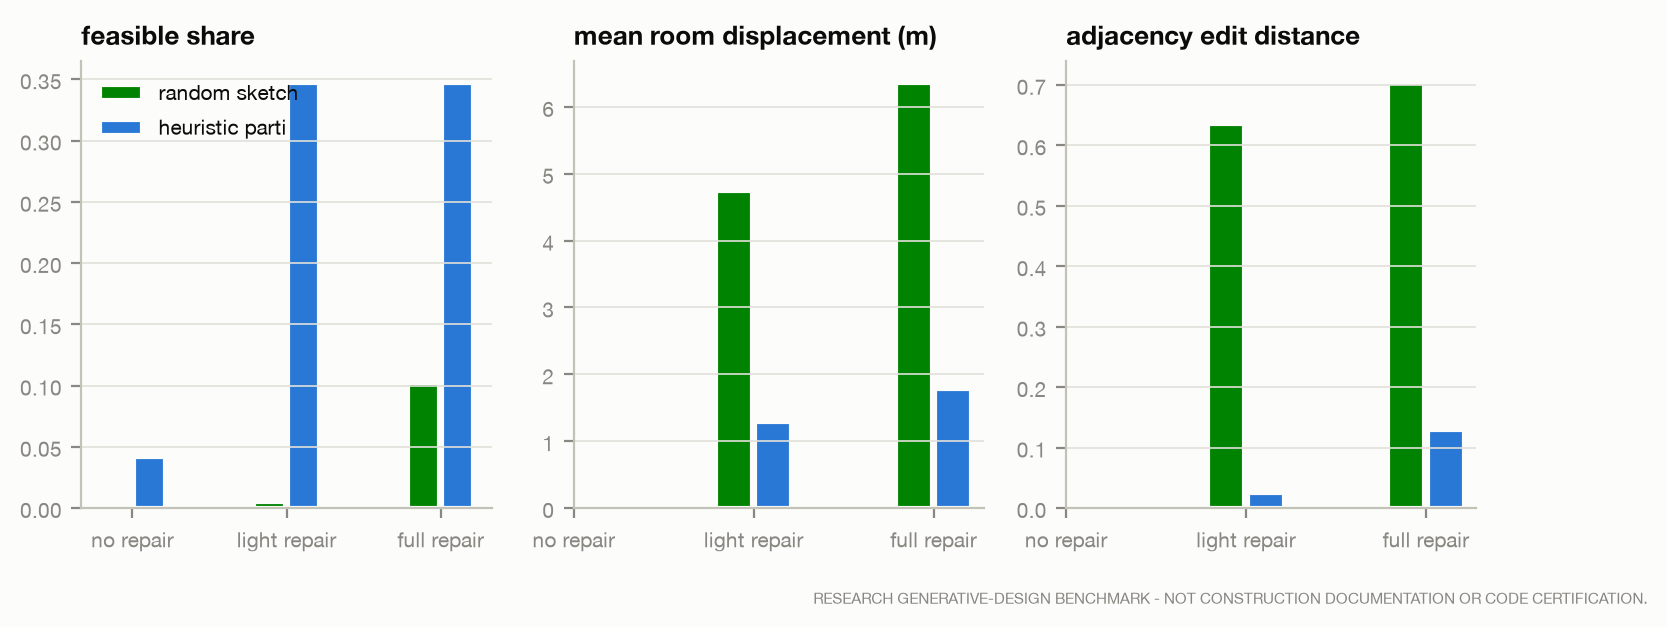
The repair pipeline was run on the LLM's two controls with 300 evaluations per proposal. Random sketches — the right programme at random positions — are never feasible as submitted; light repair, which only tunes proportions, recovers 0.5% and full repair, which may also rewire the plan, 10.2%, at a mean adjacency edit distance of 0.70: most of the sketch's topology is discarded. Heuristic partis start at 4.2% feasible and repair to 34.7% with an adjacency edit distance of only 0.13. These two bracket what an LLM proposal would have to beat.
14 Sustainability trade-offs
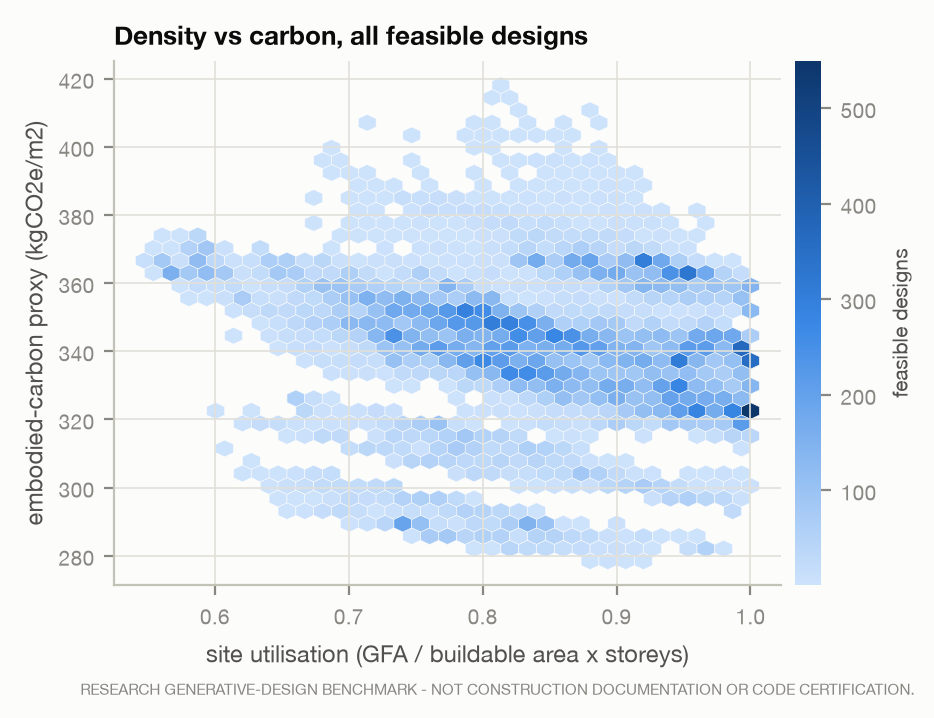
Within a brief, denser designs carry less modelled material per square metre of floor (mean Spearman ρ between density and carbon scores 0.88, 95% interval 0.83–0.92, 58 briefs), largely because a fixed slab and roof are spread over more floor. The carbon objective therefore adds little information beyond density in this proxy — one of the pre-registered negative results. Under all fourteen single-coefficient perturbations of ±50%, the method with the lowest mean best intensity is unchanged (100%).
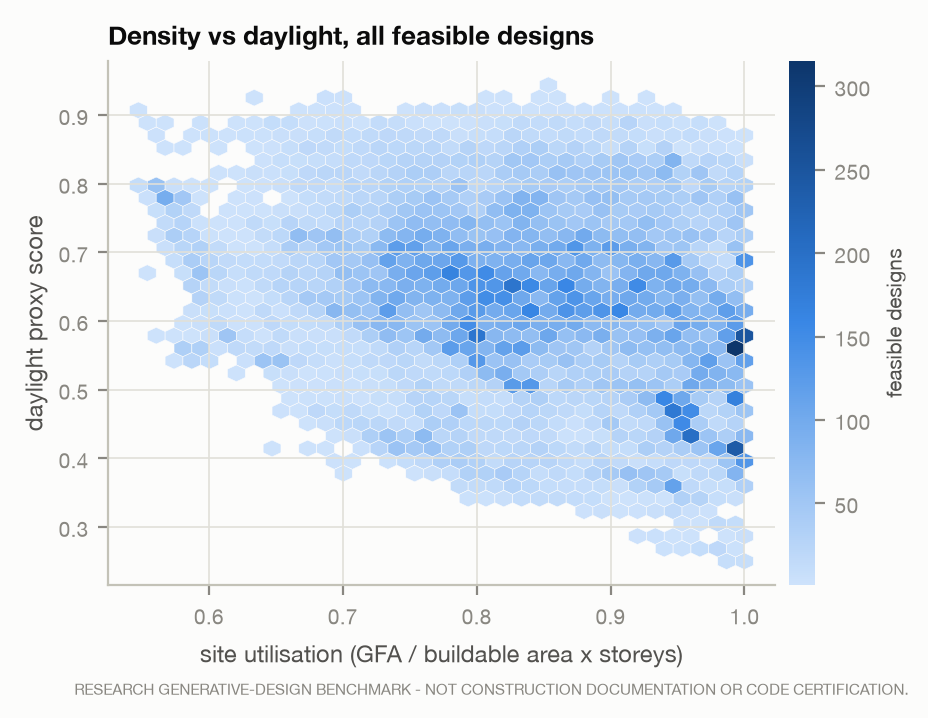
Density and daylight trade off (ρ = -0.36, -0.45–-0.27): filling more of the envelope buries more rooms behind other rooms. Density and circulation are nearly independent (ρ = -0.10). All three statements hold within the proxies only.
15 Limitations
- Every objective is a proxy and every constraint a benchmark rule. There is no simulation, certification, costing, life-cycle assessment or structural analysis, and no architect or occupant review.
- Lots are flat rectangles; rooms are axis-aligned rectangles; one storey height. Tree-based methods reach only guillotine layouts; common cores are galleries; courtyards use a fixed parti.
- Briefs are synthetic; difficulty is controlled by construction. The open-space constraint rarely binds.
- CP-SAT's encoding is sufficient rather than exact for connectivity, access and daylight, so it can reject designs the checker would accept; its matched quantity is wall-clock, not evaluations.
- The compute sweep uses an 18-brief subset and is exploratory; the matched-budget ranking of NSGA-II and simulated annealing does not hold at every budget.
- The LLM condition did not run, so nothing is claimed about language models.
- Hypervolume is a Monte Carlo estimate on normalised scores; normalisation bands shape it, and the density band was changed once, before the main run.
16 Social context
Middle housing is proposed as one response to housing affordability, and optimisation tools promise to make such schemes cheaper to design. Three cautions follow from this benchmark. First, optimising proxies rewards whatever the proxies can see: nothing here measures local context, street character, accessibility for disabled residents, or how people actually live, and a method that scores well may still produce poor homes. Second, a benchmark with a fixed parti family and a narrow representation encourages homogenised output; the diversity metrics are there partly to make that visible. Third, none of these methods replaces architectural judgement, code review or community consultation. The benchmark is a way to compare search methods honestly, not a way to design housing without designers.
17 Conclusion
Under matched compute, no single method is best. Seeded evolutionary search finds feasible designs most often, the deterministic heuristic returns the highest-quality (if narrow) fronts, and CP-SAT is the most reliable when it answers but too slow at the matched budget to answer often; given more time it overtakes the others on feasibility. Typology changes the ranking, priorities change it again, and search quality was still rising when the budget ran out. The benchmark's value is less in any one ranking than in making these dependencies measurable — and in giving LLM proposals, when they are run, a controlled place to be compared.
References
- R.H.J.M. Otten, Automatic floorplan design (1982). Design Automation Conference. [author knowledge - verify page numbers before submission]
- D.F. Wong & C.L. Liu, A new algorithm for floorplan design (1986). Design Automation Conference. [author knowledge - verify]
- S. Kirkpatrick, C.D. Gelatt, M.P. Vecchi, Optimization by simulated annealing (1983). Science 220. [author knowledge - verify]
- K. Deb, A. Pratap, S. Agarwal, T. Meyarivan, A fast and elitist multiobjective genetic algorithm: NSGA-II (2002). IEEE Trans. Evolutionary Computation 6(2). [author knowledge - verify]
- K. Deb, An efficient constraint handling method for genetic algorithms (2000). Computer Methods in Applied Mechanics and Engineering 186. [author knowledge - verify]
- E. Zitzler & L. Thiele, Multiobjective evolutionary algorithms: a comparative case study and the strength Pareto approach (1999). IEEE Trans. Evolutionary Computation 3(4). [author knowledge - verify]
- R.S. Liggett, Automated facilities layout: past, present and future (2000). Automation in Construction 9. [author knowledge - verify]
- J. Michalek, R. Choudhary, P. Papalambros, Architectural layout design optimization (2002). Engineering Optimization 34(5). [author knowledge - verify]
- E. Rodrigues, A.R. Gaspar, A. Gomes, An evolutionary strategy enhanced with a local search technique for the space allocation problem in architecture (2013). Computer-Aided Design 45(5). [author knowledge - medium confidence; verify]
- P. Merrell, E. Schkufza, V. Koltun, Computer-generated residential building layouts (2010). ACM Trans. Graphics (SIGGRAPH Asia). [author knowledge - verify]
- G. Laignel et al., Floor plan generation through a mixed constraint programming-genetic optimization approach (2021). Automation in Construction 123. [author knowledge - medium confidence; verify]
- W. Wu et al., Data-driven interior plan generation for residential buildings (RPLAN) (2019). ACM Trans. Graphics (SIGGRAPH Asia). [author knowledge - verify]
- N. Nauata et al., House-GAN: relational generative adversarial networks for graph-constrained house layout generation (2020). ECCV. [author knowledge - verify]
- N. Nauata et al., House-GAN++: generative adversarial layout refinement network (2021). CVPR. [author knowledge - verify]
- R. Hu et al., Graph2Plan: learning floorplan generation from layout graphs (2020). ACM Trans. Graphics (SIGGRAPH). [author knowledge - verify]
- M.A. Shabani et al., HouseDiffusion: vector floorplan generation via a diffusion model with discrete and continuous denoising (2023). CVPR. [author knowledge - verify]
- S. Leng et al., Tell2Design: a dataset for language-guided floor plan generation (2023). ACL. [author knowledge - verify]
- C.F. Reinhart, A simulation-based review of the ubiquitous window-head-height to daylit zone depth rule-of-thumb (2005). IBPSA Building Simulation. [author knowledge - verify]
- B. Hillier & J. Hanson, The Social Logic of Space (1984). Cambridge University Press. [author knowledge - verify]
- LETI, Embodied Carbon Primer (2020). London Energy Transformation Initiative. [search-verified 2026-09-10 (secondary summaries)]
- RIBA, 2030 Climate Challenge v2 (2021). Royal Institute of British Architects. [search-verified 2026-09-10]
- D. Parolek with A.C. Nelson, Missing Middle Housing (2020). Island Press. [author knowledge - verify]
- L. Perron & F. Didier, CP-SAT (Google OR-Tools) (2024). software. [software - cite version from results/release.json]
- G. Wang, FloorPlanBench (2026). software/benchmark (github.com/Gariyuuu/floorplanbench). [owner project notes]
Appendix: reproducibility
- Benchmark results: commit
db2e24eb00; tables re-collected with unique design ids (no job re-run) as logged in results/manifest.json. - Versions: schema 1.0.0, constraints 1.2.0, objectives 1.2.0, brief set 1.1.0 (hash
31a635ad375385d2). - Hypervolume: 262,144 Monte Carlo samples, seed 20260101. Bootstrap: 10,000 resamples, seed 20260911.
- Commands:
make setup,make test,make benchmark,make repair,make analyze,make figures,make paper,make site. - Every number in this paper is listed with its source in research/claims_registry.md.